2010年6月26日
EuroVis/Nicograph 2010
By Alejandro Toledo
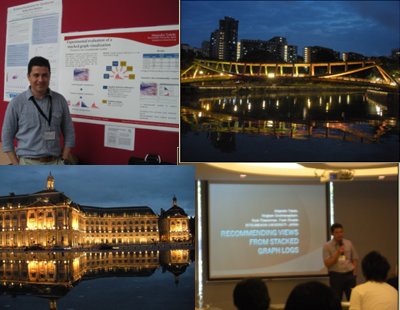
Recently I participated in two international conferences: EuroVis and Nicograph. EuroVis is the annual visualization symposium jointly organized by the Eurographics Working Group on Data Visualization and the IEEE Visualization and Graphics Technical Committee. NicoGraph, on the other hand, is organized by The Society for Art and Science. This year EuroVis took place in Bordeaux, France, where I participated in a poster / demo session. At Nicograph, this time in Singapore, I participated in a paper session. During both events, I presented the results of a research on information visualization and visual analytics that our research group has been recently conducting. Basically, this research focuses on the analytical side of information visualization systems, e.g., how effective they are as cognitive tools. As in a previous work, we continue the work on the Stacked Graph visualization and now our system has an extension to enable visual analytics on it. This new functionality has been tested on a usability study and reported to be presented at EuroVis and Nicograph.
e-mail: alex[at]ice.ci.ritsumei.ac.jp
URL: http://www.ice.ci.ritsumei.ac.jp/~alex/
トラックバック(0)
このブログ記事を参照しているブログ一覧: EuroVis/Nicograph 2010
このブログ記事に対するトラックバックURL: https://www.arc.ritsumei.ac.jp/lib/mt_gcoe/mt-tb.cgi/3375
コメントする
- 最近のエントリー
- KES IIMSS 2011 Best Research Paper Award
- DH 2011 at Stanford University USA
- DMDCM 2011 at Hangzhou China
- 2-months Visit at Institute for Media Innovation
- ACE2010@Taipei
- アーカイブ
- 2011年10月 [1]
- 2011年6月 [1]
- 2011年5月 [1]
- 2011年3月 [1]
- 2010年11月 [1]
- 2010年9月 [1]
- 2010年7月 [2]
- 2010年6月 [1]
- 2009年12月 [1]
- 2009年10月 [1]
- 2009年8月 [1]